Descrição
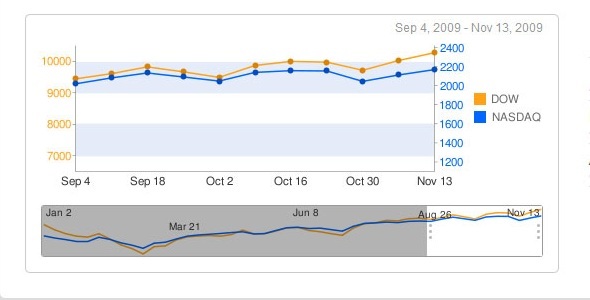
Create your own Google Chart and this jQuery plugin will transform it into a zoomable scrollable chart!
It’s as easy as this:
$('#chart').gChartScroller();
It creates a smaller chart that is not zoomed-in below. Then, using your mouse, you can zoom in and scroll across the x axis.
You can even pass in a date range for the x axis and it will create the x axis labels for you. That’s something that the Google Chart API doesn’t provide you. Then, you can also pass in a date just like you do in PHP to get the labels formatted just the way you want.
There is also a function that is provided for you so that you can have links that change the currently zoomed-in range:
$('#chart').gChartSet(startX, endX);
You have complete control over the styles and colors. The Google Chart API allows you to customize any colors, fonts, etc. in the graphs and every generated HTML element has a class applied for easy CSS styling (it only generates 9 elements).
Here is a list of the options that you can (optionally) pass in:
- The height of the lower scrolling chart
- Any additional Google Chart variables that you want to be applied to the lower chart and not to the upper chart
- The x axis minimum and maximum range (date or number)
- The default zoomed-in minimum and maximum range (date or number)
- The number of labels you want to show on the lower chart’s x axis
- The format for any dates in the axis labels
- An onChange() callback function that will get called when the user changes the zoomed-in range
- An onDrag() callback function that will be called as the user drags/resizes the zoomed-in range
- Gracefully degrades to just show the chart if JavaScript is not enabled
Note: this plugin only works with Google Chart type “lc”


